Visual
Analytics and Imaging Laboratory (VAI Lab) Computer Science Department, Stony Brook University, NY |
Visual
Analytics and Imaging Laboratory (VAI Lab) Computer Science Department, Stony Brook University, NY |
Julia EunJu Nam, Klaus
Mueller |
Abstract: Gaining a true appreciation of high-dimensional space remains difficult since all of the existing high-dimensional space
exploration techniques serialize the space travel in some way. This is not so foreign to us since we, when traveling, also experience the
world in a serial fashion. But we typically have access to a map to help with positioning, orientation, navigation, and trip planning. Here,
we propose a multivariate data exploration tool that compares high-dimensional space navigation with a sightseeing trip. It decomposes
this activity into five major tasks: 1) Identify the sights: use a map to identify the sights of interest and their location; 2) Plan the trip:
connect the sights of interest along a specifyable path; 3) Go on the trip: travel along the route; 4) Hop off the bus: experience the location,
look around, zoom into detail; and 5) Orient and localize: regain bearings in the map. We describe intuitive and interactive tools for all of
these tasks, both global navigation within the map and local exploration of the data distributions. For the latter, we describe a polygonal
touchpad interface which enables users to smoothly tilt the projection plane in high-dimensional space to produce multivariate
scatterplots that best convey the data relationships under investigation. Motion parallax and illustrative motion trails aid in the perception
of these transient patterns.We describe the use of our system within two applications: 1) the exploratory discovery of data configurations
that best fit a personal preference in the presence of tradeoffs and 2) interactive cluster analysis via cluster sculpting in N-D.
Teaser: Exploring a network traffic dataset consisting of traffic data
captured over an hour, in tcpdump format. The data set contains 15 dimensions and we have chosen source IP,
destination IP, and time stamp for the exploration. Here, before transitioning the projection
plane, we divide the current projection into grid cells and assign a unique color to all packets projecting into a given cell.
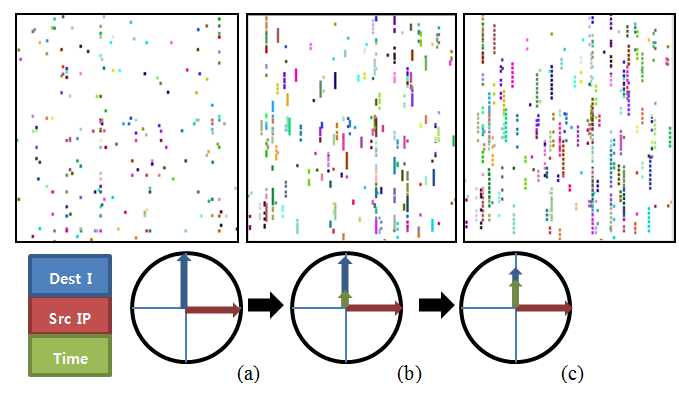
(a) Initial scatterplot of dest_IP vs. src_IP all packets projecting onto similar (x, y) coordinates are assigned the same color, (b) tilting the projection plane to reveal time relationships formerly superimposed packets now visualize as shorter or longer colored streaks along the y-axis, (c) tilting the plane further reveals individual packets.
Video: Watch it to get a quick overview:
Paper: J. Nam
and K. Mueller, "TripAdvisorN-D: A Tourism-Inspired High-Dimensional Space
Exploration Framework with Overview and Detail," IEEE Transactions on
Visualization and Computer Graphics, 19(2): 291-305, 2013.pdf