Visual
Analytics and Imaging Laboratory (VAI Lab) Computer Science Department, Stony Brook University, NY |
Visual
Analytics and Imaging Laboratory (VAI Lab) Computer Science Department, Stony Brook University, NY |
Abstract: The
navigation of high-dimensional data spaces remains challenging, making multivariate
data exploration difficult. To be effective and appealing for mainstream application,
navigation should use paradigms and metaphors that users are already familiar
with. One such intuitive navigation paradigm is interactive route planning
on a connected network. We have employed such an interface and have paired
it with a prominent high-dimensional visualization paradigm showing the N-D
data in undistorted raw form: parallel coordinates. In our network interface,
the dimensions form nodes that are connected by a network of edges representing
the strength of association between dimensions. A user then interactively
specifies nodes/edges to visit, and the system computes an optimal route,
which can be further edited and manipulated. In our interface, this route
is captured by a parallel coordinate data display in which the dimension ordering
is configured by the specified route. Our framework serves both as a data
exploration environment and as an interactive presentation platform to demonstrate,
explain, and justify any identified relationships to others. We demonstrate
our interface within a business scenario and other applications.
Teaser: Exploring correlations
with the sales dataset. The goal is to analyze the sales strategies of three
sales teams, labled red, green and blue. Each team has 300 sales people. The
variables of interest are: # initial leads generated (#Leads), # initial leads
won (#LeadsWon), cost expended per such lead (cost/wonLead), and finally #
of concrete sales opportunities (#Opps) generated from these won leads.
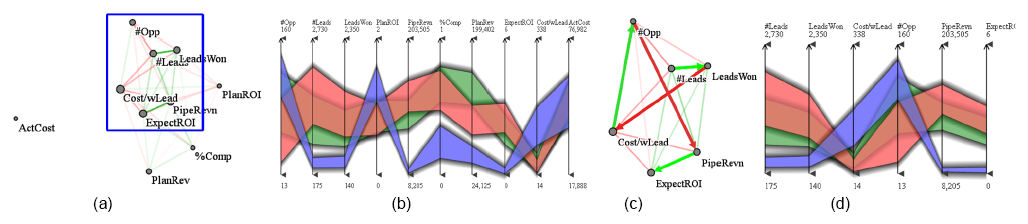
(a) Original dimension network display laid out by data correlations, along with automatically computed optimal route. (b) Linked parallel coordinate display with axis order determined by the route in (a). (c) The user zooms into the network (blue rectangle in (a)) and manually specifies a route that seems to better capture what is really going on – the strategic model of winning the most customers. (d) Linked parallel coordinate display with updated axes ordering according to the route of (c).
This plot reveals that while the blue team generates and wins fewer initial leads (# leads, # won leads), it expends more funds on each such lead (costWonLead) and this allows them to transform these leads into concrete sales opportunities (#Opp). The other teams take a more shallow approach -- they generate lots of leads but do not spend much money on each and so do not win them over. The results show that this is not a good strategy. Furthermore, there is also much more variation in the red and green sales teams, e. g, thicker bands. There appear to be a few good sales people (upper portion of the bands) but also a quite a few ineffective ones (lower portions) which one might want to train or eliminate.
Video: Watch it to get a quick overview:
Paper: Z. Zhang,
K. McDonnell, K. Mueller, "A Network-Based Interface for the Exploration of
High-Dimensional Data Spaces," IEEE Pacific Vis, pp. 17-24, Songdo,
Korea, March, 2012. pdf
ppt